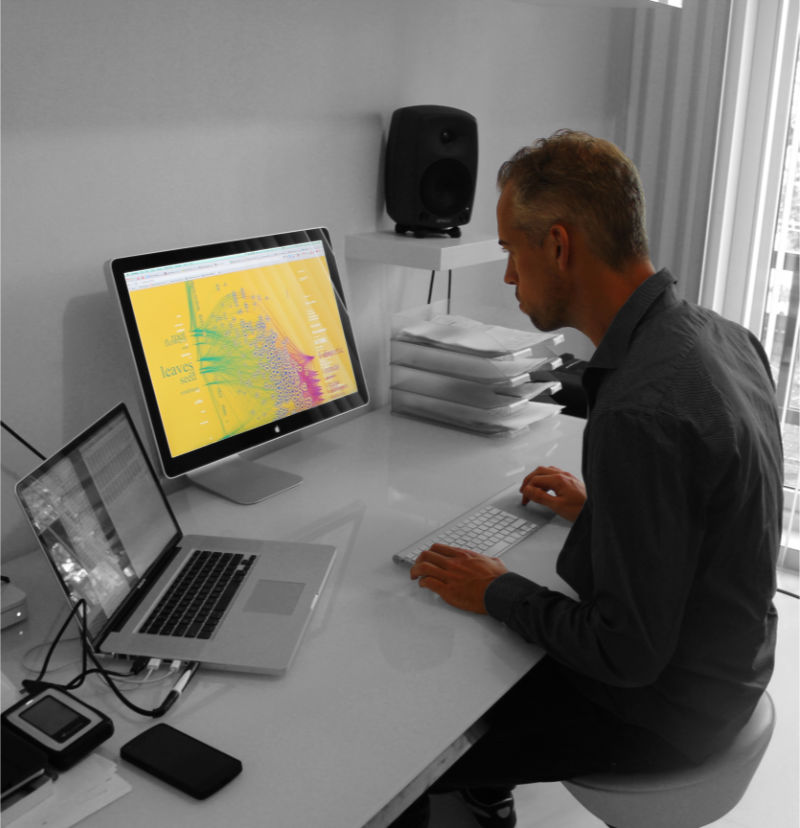
Hi, I'm Jan Willem,
I create
Data Visualizations


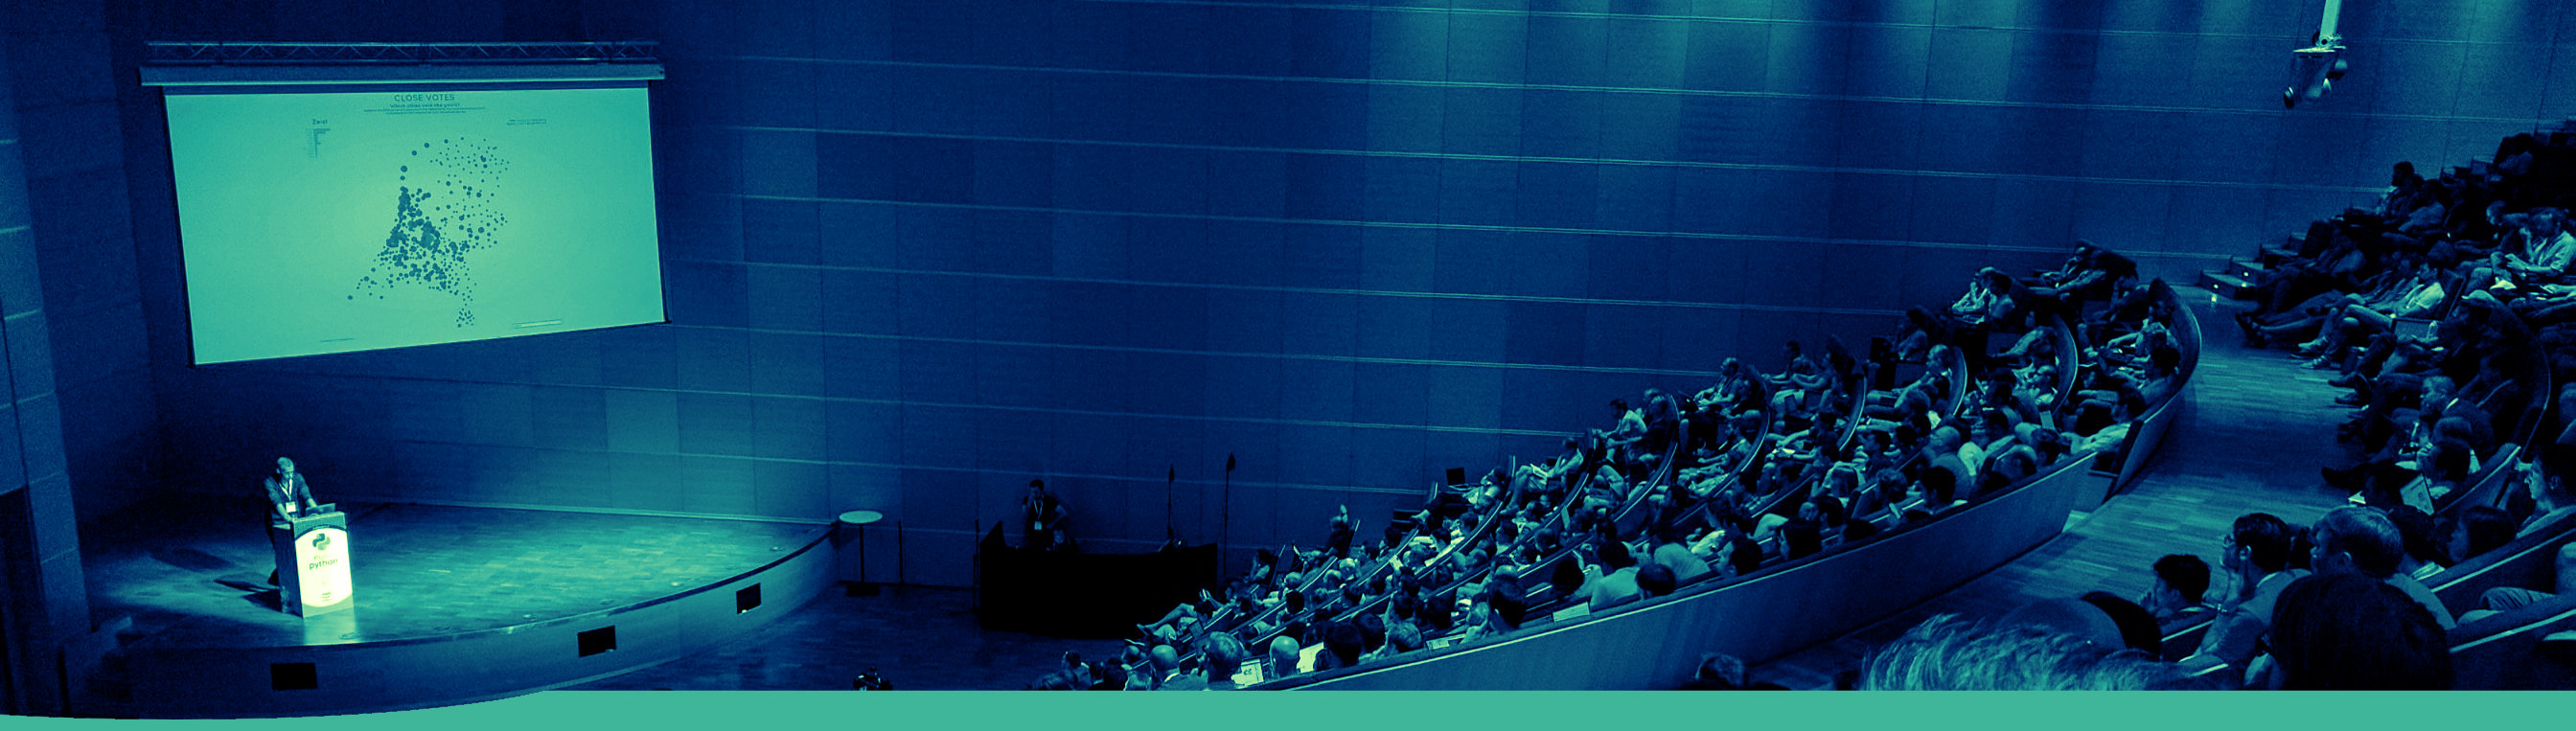
Notable talks
Past
Testimonials
Jan Willem's collaboration with the European Space Agency has been outstanding. His visualisations for our Gaia mission have brought beautiful, educational, and inspiring new dimensions to its quest to reveal the secrets of our Milky Way galaxy, and all in a scientifically-rigorous way. I can't recommend working with Jan Willem highly enough.
Mark McCaughrean - Senior Science Advisor
European Space Agency (ESA)
Working with Jan Willem was very inspiring. After presenting the complexities of the Connectome of the fly brain to him, we asked him to think outside the box and present visualization options that were non-traditional in our field. Jan Willem did not let us down! Collaborating with him gave us more insights about our own data! His visuals spectacularly translate complex content into beautiful art that tells a story. I would not hesitate to work with Jan Willem again for future projects.
Ruchi Parekh - Neuroscientist / Connectome Team Manager
Howard Hugues Medical Institute
After presenting the Dutch Railways (NS) and the direction we wanted to take for our annual report, I asked Jan Willem to think outside the box and be creative. He delivered an incredible designs that exceeded my expectations. If you have the opportunity to work with him, I say go for it! You are guaranteed in an enjoyable and productive experience. He is skilled at what he does, independent and suprises. Thanks again Jan Willem fort his incredible ride.
Gerjan Vasse - Hoofd Content & Creatie
NS - Dutch Railways
Jan Willem is a joy to work with. On editorial projects, he strikes the perfect balance between being an independent problem-solver and a collaborative team-member.
Jennifer Christiansen - Senior Graphics Editor
Scientific American
We worked with Jan Willem Tulp to develop and implement visual structures for discourse and argumentation mapping in archival contexts. He is not only very up-to-date on all relevant technologies, he is able to listen deeply, to cooperate effectively and to translate complex and many-layered issues in viable procedures. It has been a please to work with him and we are looking forward to continue our collaboration.
Theo Hug and the DigiVis Team - Professor of Educational Sciences at the Department of Media, Society and Communication
University of Innsbruck
Awards
- ☆ HPE Art Award · nominated
- ☆ Malofiej · silver & bronze
- ☆ Information is Beautiful Awards· silver
- ☆ Visualizing.org· multiple wins
Exhibitions
- • 1 2 3 Data, France (2018)
- • Natural Recall, Italy (2014)
- • Ars Electronica, Austria (2012, 2019)
- • The Art of Networks, USA (2012)
Judging
- • Information is Beautiful Awards
- • Visualizing Cities
- • Malofiej
- • National Science Foundation Vizzies
Workshops
Dataviz Fundamentals
An introduction to the principles of data visualization design. The goal of the workshop is to increase data- and visual literacy. No experience required. No computer is required during the workshop — all exercises are done with pen and paper.
request infoIntroduction D3
An introduction to creating visualizations with D3. The goal of the workshop is to learn the most common parts and usage of the D3 visualization library. Basic programming skills are required.
request infoNotable book appearances

My story
Being raised in a creative family, my wish as a child had always been to become an artist. Yet at an early age I found out that the world of computers fascinated me also. So, as a synthesis, I decided to study interaction design, hoping to find a job where I could apply my skills both on design and software.
After my study, it appeared that the jobs I was looking for were hard to find. When I look back now, I clearly see how my career repeatedly switched between working for very creative companies that always appeared to offer too little technical challenge for me, and working for very technical companies where there was not enough work that met my need for designing.
In 2010 I found out that there existed such a thing as data visualization. For me that was, and still is, the ultimate combination of software, design and interaction. I decided to become a freelancer. One year later I started my company TULP Interactive. This turned out to be the right choice: I have been creating data visualizations ever since.